

Deep Dive into Helium 10 Xray: Unpacking Amazon Product Research Data 📊🔍
Welcome to a thorough exploration of Helium 10 Xray, a powerful product research tool designed to provide Amazon sellers with real-time data and insights directly from Amazon search results pages. Whether you're a new seller validating product ideas or a seasoned veteran scouting for lucrative opportunities, Xray grants you access to critical metrics—like estimated sales, revenue, fees, and competition levels—without ever leaving Amazon. This tool is part of the broader Helium 10 suite, which offers an integrated ecosystem for product research, keyword optimization, and listing improvement. In this guide, we'll break down how to interpret the data provided by Xray, how to use it to make informed decisions, and how to avoid common pitfalls. By the end, you'll be equipped to leverage Xray's data to uncover profitable products, estimate potential earnings, and minimize risks in your Amazon business. Let's get started! 🚀
What is Helium 10 Xray and Why is it Important? 🤔💡
Helium 10 Xray is a browser extension—compatible with Chrome and Firefox—that overlays real-time data onto Amazon search results and product pages. When activated, it provides instant insights into key metrics such as estimated monthly sales, revenue, number of competitors, review counts, and Amazon fees for products in a given niche. This allows sellers to quickly assess market demand, competition intensity, and profitability without manually scraping data or relying on guesswork Helium 10 coupon code .
Xray is particularly valuable for conducting product research because it helps you:
- Validate product ideas by showing whether a niche has sufficient demand.
- Analyze competition to understand how saturated a market is.
- Estimate profitability by calculating potential revenue minus Amazon fees and other costs.
- Spot trends by observing sales velocities and review velocities of top products.
For example, if you're considering selling water bottles, Xray can show you the estimated sales of top competitors, the average price point, and how many reviews leading products have—all at a glance. This data-driven approach reduces the risk of entering oversaturated markets or choosing products with low profitability.
How Xray Integrates with the Helium 10 Ecosystem
Xray is not a standalone tool; it works seamlessly with other Helium 10 products like Cerebro (for reverse ASIN lookup), Magnet (for keyword research), and Black Box (for product discovery). For instance, you might use Black Box to generate product ideas, then use Xray to validate those ideas by analyzing top sellers in the niche. This integration creates a cohesive workflow that streamlines product research and optimization.
Key Metrics Provided by Xray
When you activate Xray on an Amazon search results page, it displays a dashboard with several critical metrics:
- Estimated Monthly Sales: The approximate number of units sold per month for each product.
- Estimated Monthly Revenue: The approximate monthly revenue generated (price × sales).
- Number of Reviews: The total reviews a product has, indicating its age and popularity.
- Review Velocity: The rate at which new reviews are added, hinting at recent sales performance.
- Amazon Fees: Estimated referral and FBA fees for each product.
- Competition Level: A score indicating how saturated the niche is.
Understanding these metrics is crucial for making informed decisions, which we'll explore in the following sections.
The Importance of Real-Time Data
Unlike some tools that rely on historical data, Xray pulls real-time information from Amazon, giving you an up-to-date snapshot of the market. This is vital in fast-moving niches where trends can shift rapidly. For instance, during holiday seasons, sales data might spike, and Xray can capture those changes immediately.
Use Cases for Xray
Xray is versatile and can be used for:
- Product Research: Quickly assessing multiple products in a niche.
- Competitor Analysis: Understanding how well competing products are performing.
- Pricing Strategy: Determining optimal price points based on competitor pricing and sales.
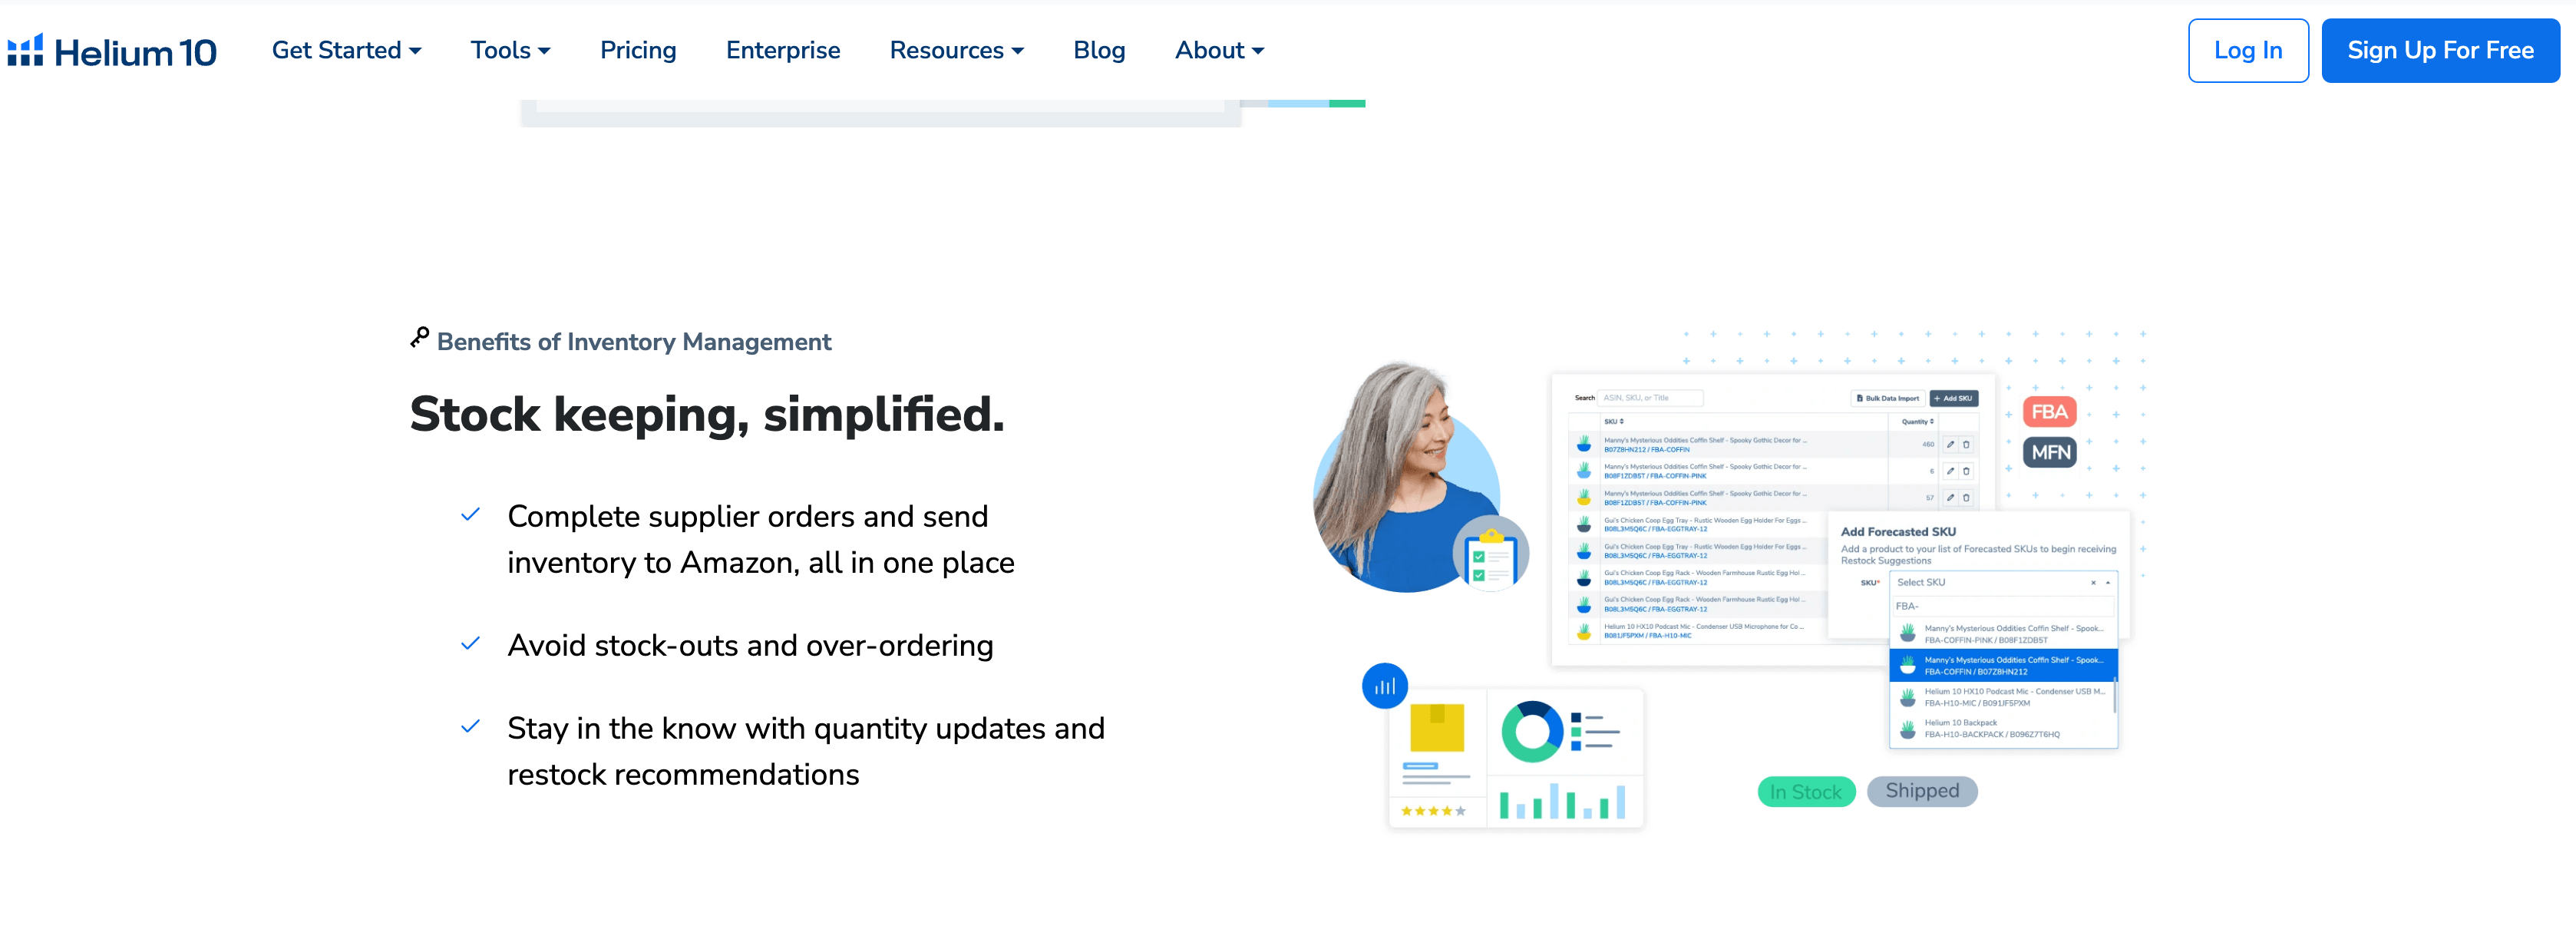
- Inventory Planning: Estimating demand to manage stock levels effectively.
By mastering Xray, you empower yourself to make data-backed decisions that enhance your chances of success on Amazon.
Installing and Setting Up Helium 10 Xray 🛠️📥
To start using Helium 10 Xray, you'll need to install it as a browser extension and configure it according to your needs. The setup process is straightforward, but proper configuration ensures you get the most accurate and relevant data. Here's a step-by-step guide to getting started.
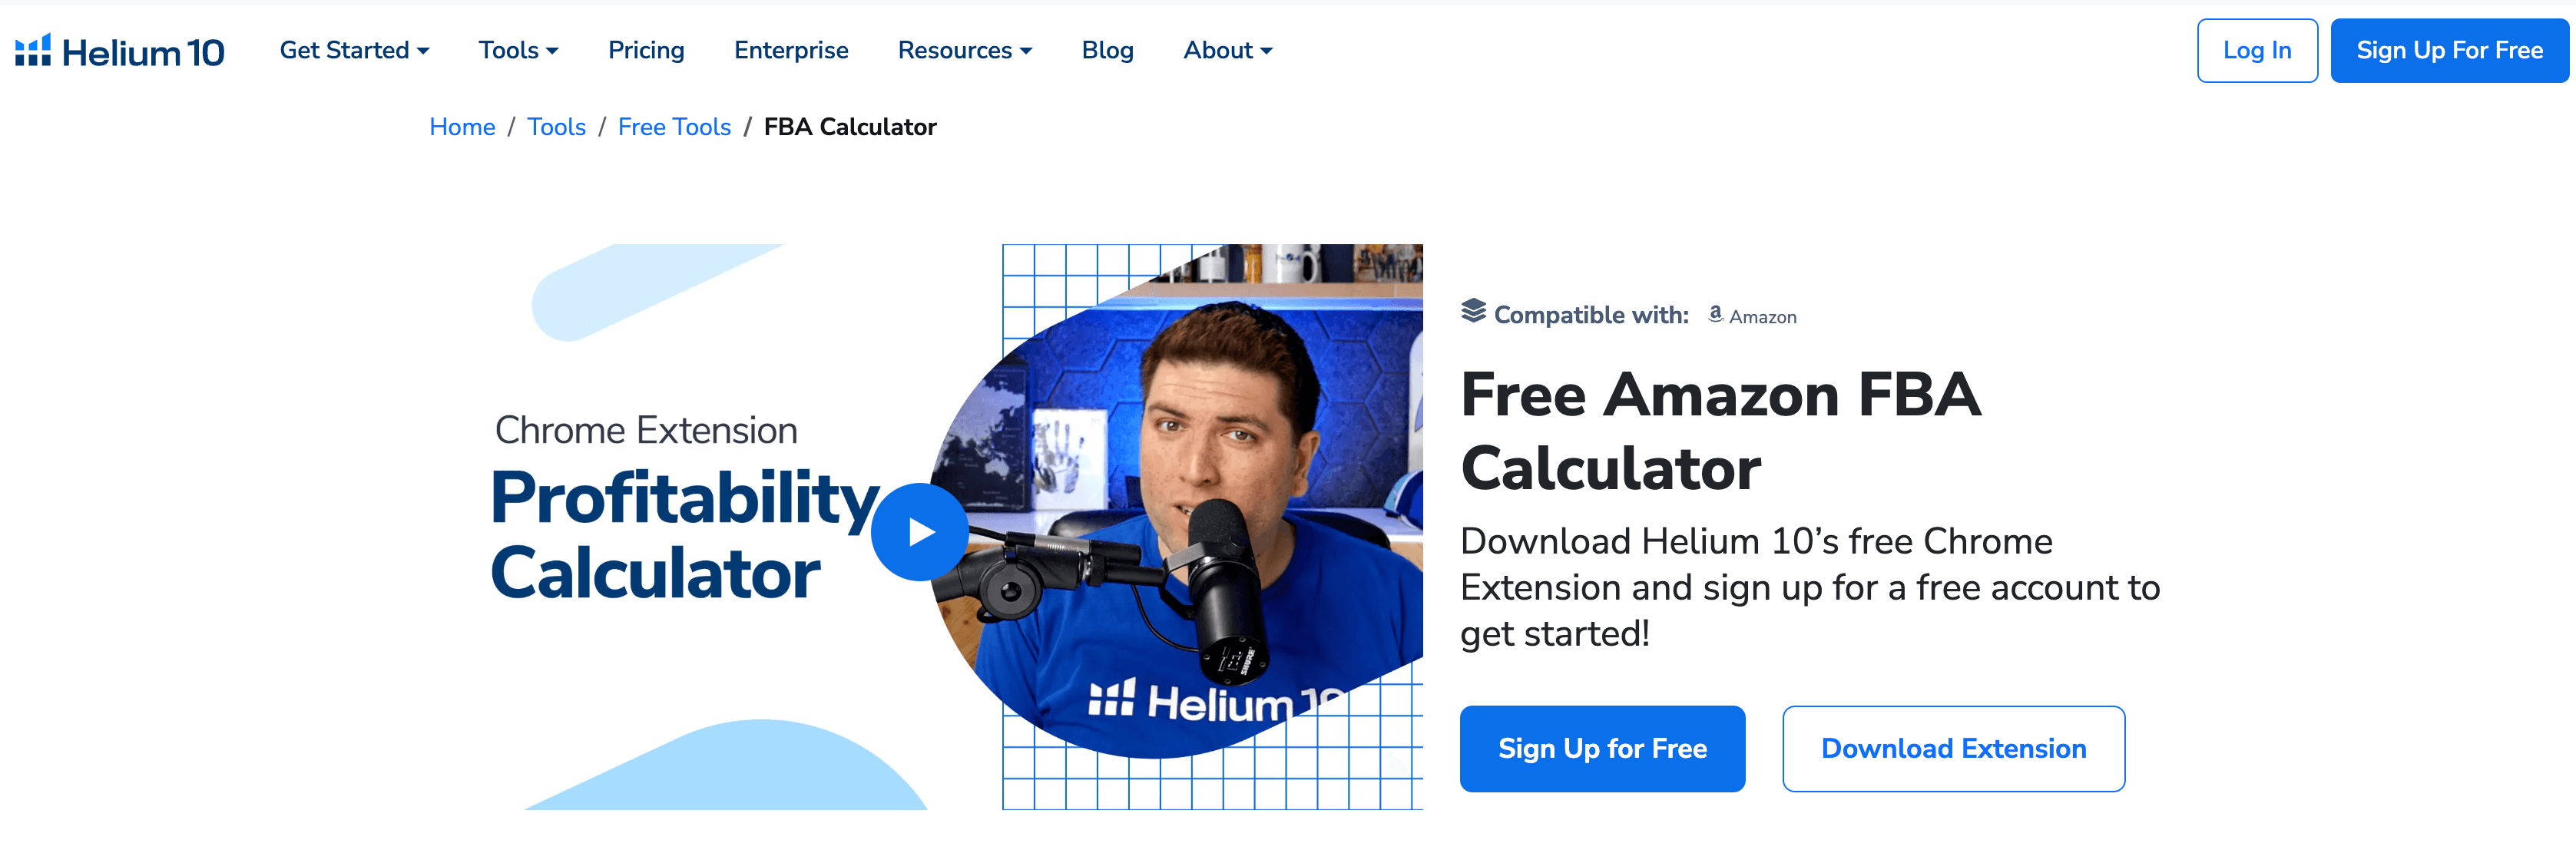
Step 1: Choose Your Browser and Install the Extension
Xray is available for Google Chrome and Mozilla Firefox. If you don't already have the Helium 10 Chrome extension, you can download it from the Chrome Web Store or the Helium 10 website. For Firefox, visit the Firefox Add-ons site. Installation is similar to any other browser extension—click "Add to Chrome" or "Add to Firefox," and follow the prompts. Once installed, you'll see the Helium 10 icon in your browser toolbar.
Step 2: Log In to Your Helium 10 Account
After installation, click the Helium 10 icon in your toolbar and log in with your Helium 10 credentials. If you don't have an account, you'll need to sign up for a plan that includes Xray. Most paid plans (e.g., Platinum, Diamond) offer access to Xray, but check the specifics based on your subscription.
Step 3: Configure Xray Settings
Before using Xray, configure its settings to match your research goals. Click the Helium 10 icon, navigate to the Xray section, and adjust parameters like:
- Default Country: Set to the Amazon marketplace you're targeting (e.g., Amazon.com, Amazon UK).
- Fees Calculation: Input your expected product cost, shipping cost, and other expenses to get accurate profit estimates.
- Data Preferences: Choose which metrics to display prominently (e.g., sales, revenue, reviews).
Proper configuration ensures that the data you see is tailored to your business model, whether you're using FBA (Fulfillment by Amazon) or FBM (Fulfillment by Merchant).
Step 4: Activate Xray on Amazon
Navigate to Amazon.com and perform a search for a product category you're interested in (e.g., "yoga mats"). Once the search results load, click the Helium 10 icon in your toolbar and activate Xray. You'll immediately see an overlay on the search results page with metrics for each product. You can also activate Xray on individual product pages to get detailed data for a specific item.
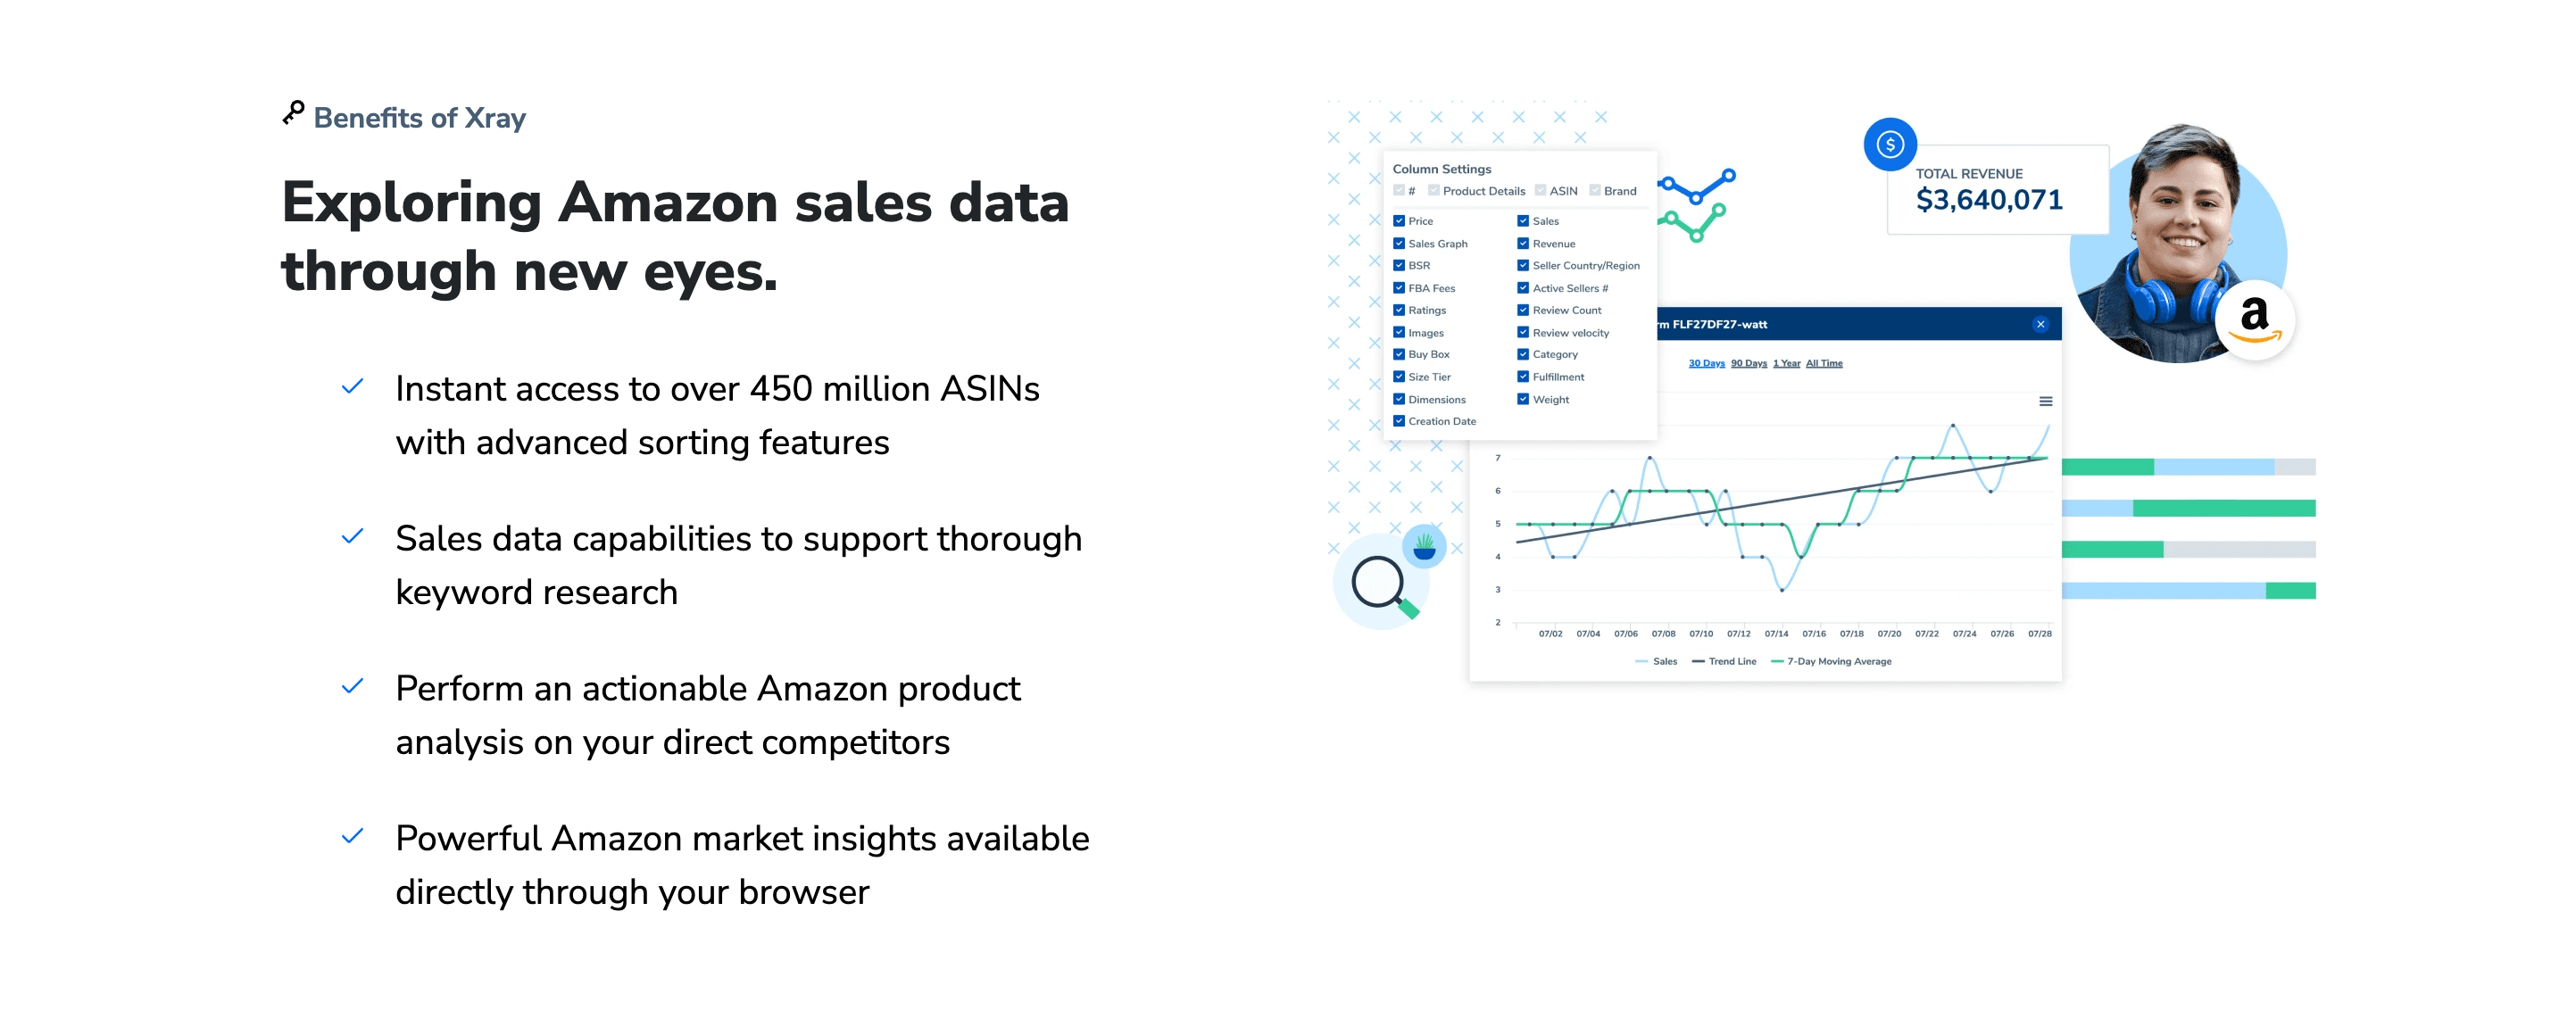
Step 5: Interpret the Dashboard
Upon activation, Xray displays a table-like overlay with columns for each metric. Take time to familiarize yourself with the layout:
- Each row corresponds to a product in the search results.
- Columns show metrics like Estimated Sales, Revenue, Reviews, etc.
- Use sorting options to organize data by any column (e.g., sort by sales to see top-performing products).
Tips for First-Time Users
- Start with broad searches to get a feel for the data.
- Use the "Help" feature within Xray for explanations of each metric.
- Experiment with different settings to see how they affect profit calculations.
With Xray installed and configured, you're ready to dive into product research. Next, we'll break down how to interpret each metric in detail.
Interpreting Estimated Sales and Revenue Data 📈💰
One of the most valuable features of Helium 10 Xray is its ability to provide estimated monthly sales and revenue for products directly on Amazon search results. These estimates are based on algorithms that analyze factors like sales rank, review velocity, and historical data. While they are not 100% accurate, they offer a reliable approximation that helps sellers gauge demand and profitability.
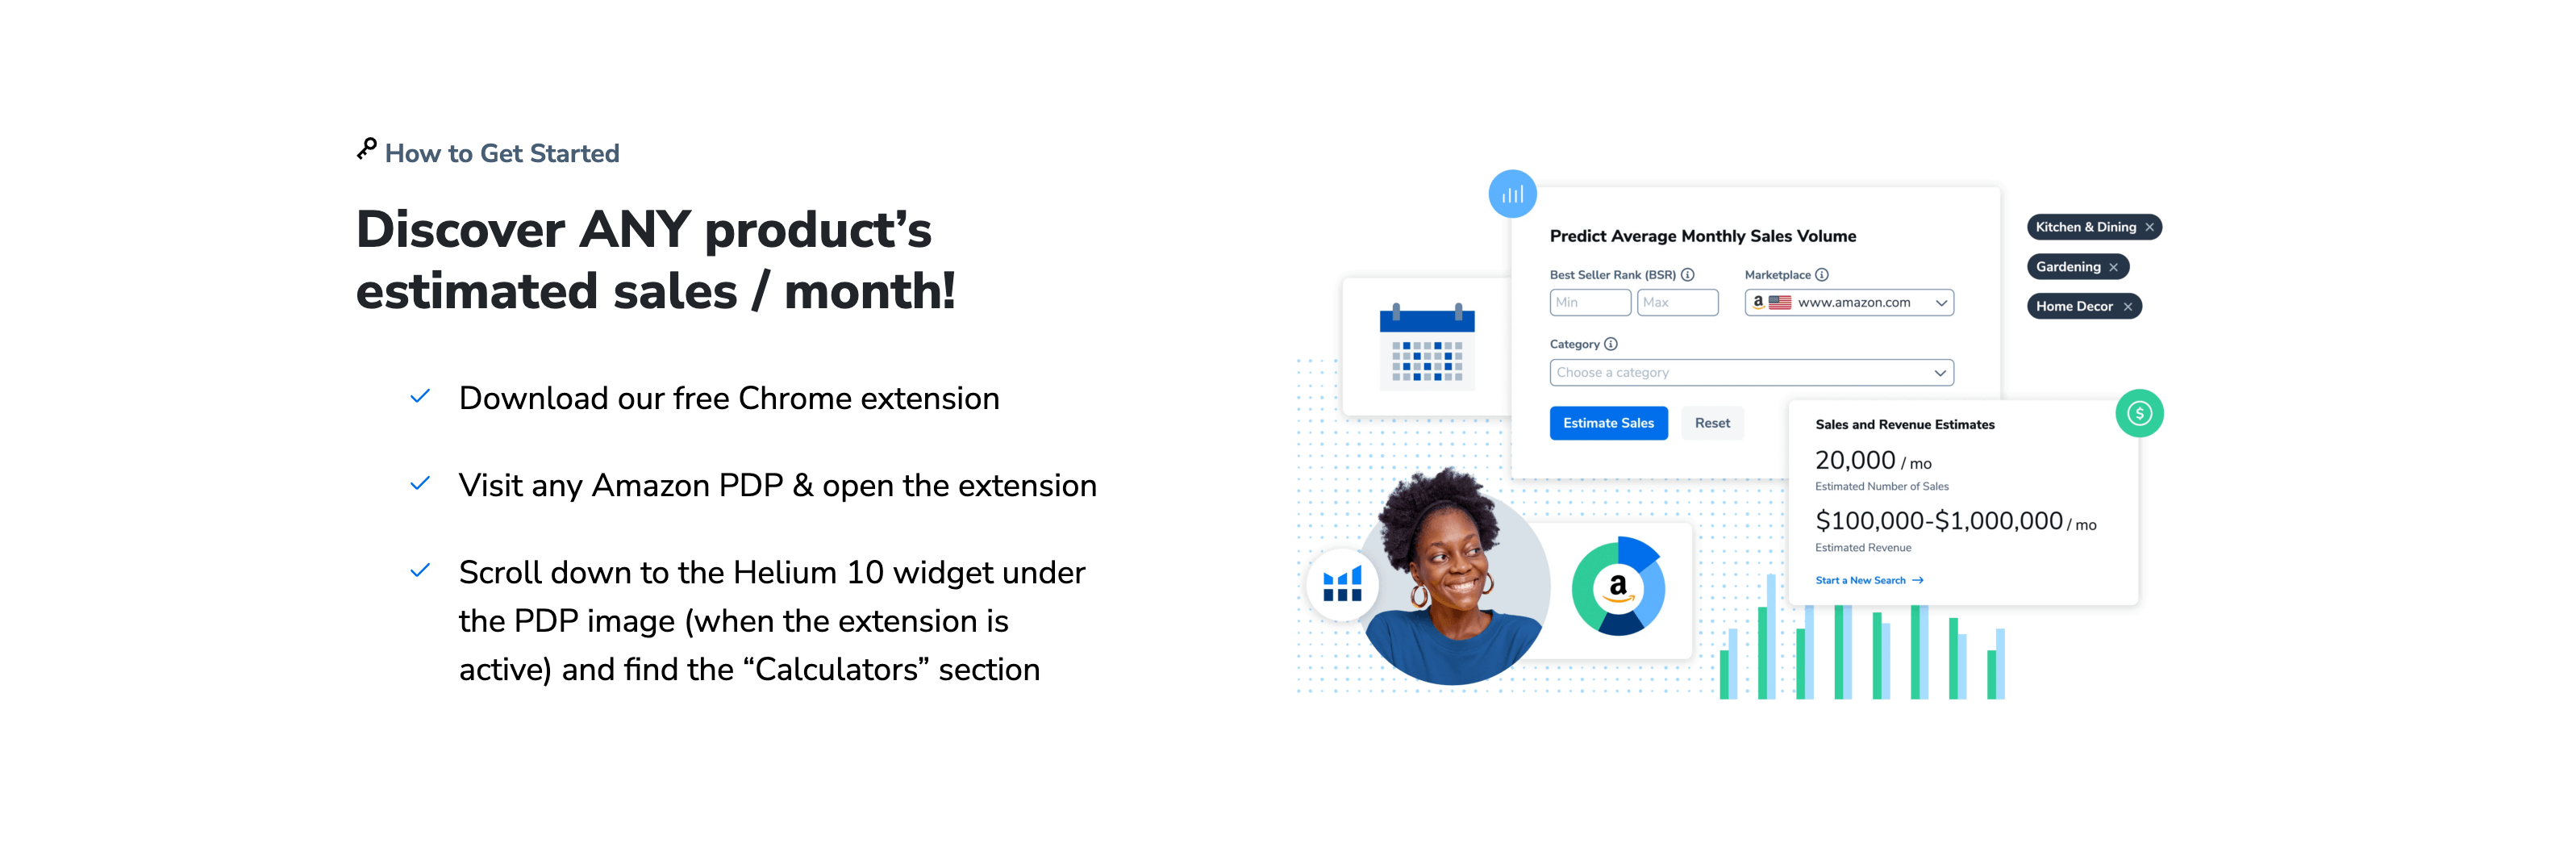
How Sales Estimates are Calculated
Xray uses Amazon's Best Sellers Rank (BSR)—a metric assigned to every product based on its sales performance—to estimate monthly sales. Products with a lower BSR (e.g., #1 in a category) sell more units than those with a higher BSR. Xray correlates BSR with sales volume using proprietary algorithms, which are refined based on historical data and marketplace trends. However, it's important to note that:
- BSR can fluctuate daily, so sales estimates are snapshots in time.
- Estimates are more accurate for products with stable BSRs and less accurate for new or volatile products.
- Different categories have different sales curves (e.g., electronics sell differently than home goods).
Why Revenue Matters
Revenue estimates are derived by multiplying the estimated sales by the product's price. This gives you a sense of the total money generated in a niche. For example, if a product has an estimated 500 sales per month and a price of $20, the monthly revenue is $10,000. However, revenue alone doesn't equal profit—you must subtract costs like Amazon fees, product cost, and shipping to determine profitability.
Using Sales Data to Assess Demand
When researching a niche, look for:
- Consistent Sales: Products with steady sales over time indicate stable demand.
- Sales Volume: High sales volumes (e.g., 1,000+ units/month) suggest a healthy market but may also indicate high competition.
- Trends: Spikes in sales might indicate seasonal demand or recent promotions.
For instance, if you're researching "resistance bands," Xray might show that top products sell 2,000 units monthly, indicating strong demand. But if the top product only sells 100 units, the niche might be too small.
Comparing Revenue Across Products
Xray allows you to sort search results by revenue to see which products generate the most money. This helps identify lucrative niches. However, high revenue doesn't always mean high profit—a product with high revenue might have thin margins due to high fees or costs. Always cross-reference revenue with profit estimates.
Limitations and How to Mitigate Them
Sales and revenue estimates are approximations. To improve accuracy:
- Use Xray over multiple days to observe trends.
- Combine with other tools like Helium 10 Black Box for broader market analysis.
- Validate with actual sales data if you have access to it (e.g., from own products).
By critically interpreting sales and revenue data, you can identify niches with genuine demand and avoid those that are oversaturated or declining.
Analyzing Competition and Review Metrics 🥊📝
Beyond sales and revenue, Helium 10 Xray provides crucial metrics related to competition and reviews, which help you understand the competitive landscape and product longevity. These metrics include the number of competitors, review counts, and review velocity.
Understanding Review Counts and Velocity
Review counts indicate how many reviews a product has accumulated. Generally, products with more reviews are older and have established themselves in the market. However, a high review count doesn't always mean high sales—some products accumulate reviews slowly over years.
Review velocity—the rate at which new reviews are added—is often a better indicator of recent sales performance. For example, if a product gains 50 reviews in a month, it likely sells well recently. Xray shows review velocity, helping you spot products that are gaining traction.
How to Use Review Data
- Assess Market Maturity: If top products have 1,000+ reviews, the niche might be mature and competitive.
- Identify Rising Products: Products with low review counts but high review velocity might be new and gaining popularity.
- Evaluate Product Quality: Lots of negative reviews might indicate product issues, but Xray doesn't show review ratings—you'll need to click into the product for that.
Analyzing Competition Level
Xray provides a competition score or shows the number of sellers in a niche. This helps you gauge how saturated a market is. For example:
- Low Competition: Few sellers might indicate an opportunity, but ensure there's enough demand.
- High Competition: Many sellers could mean it's hard to break in, unless you have a unique angle.
Using Data to Avoid Oversaturated Markets
If Xray shows that the top 10 products for "phone cases" all have estimated sales over 5,000 units monthly but also have 10,000+ reviews and 100+ competitors, it might be oversaturated. In such cases, consider sub-niches (e.g., "eco-friendly phone cases") where competition is lower.
Case Study: Analyzing a Niche
Suppose you're researching "yoga mats." Xray might reveal:
- Top product: 3,000 sales/month, 2,000 reviews, review velocity of 100/month.
- Average competitors: 50 sellers.
This indicates strong demand but high competition. You might decide to target a sub-niche like "extra thick yoga mats" if data shows lower competition there.
Integrating with Other Tools
Use Xray alongside Helium 10 Cerebro to analyze competitors' keywords or Magnet to find low-competition keywords. This holistic approach gives a fuller picture of the competitive landscape.
By mastering competition and review metrics, you can identify niches where you can compete effectively and avoid those where established players dominate.
Estimating Profitability with Xray's Fee Calculator 💵📉
Profitability is the ultimate goal, and Helium 10 Xray includes a fee calculator that estimates your potential profit after accounting for Amazon fees, product costs, and shipping. This feature is customizable, allowing you to input your specific costs for accurate calculations.
How the Fee Calculator Works
When you activate Xray, you can input:
- Product Cost: How much you pay to source or manufacture the product.
- Shipping Cost: The cost to ship the product to Amazon's warehouse (for FBA) or to customers (for FBM).
- Other Costs: Such as marketing expenses or packaging.
Xray then uses Amazon's fee structure (referral fees, FBA fees, etc.) to estimate your net profit per unit and monthly profit.
Understanding Amazon Fees
Amazon charges several fees:
- Referral Fee: A percentage of the sale price (usually 8-15%, depending on category).
- FBA Fees: If using Fulfillment by Amazon, these include picking, packing, and shipping fees.
- Storage Fees: Monthly fees for storing inventory in Amazon's warehouses.
Xray calculates these automatically based on the product's category and price.
Calculating Break-Even and Profit Margins
With Xray, you can determine:
- Break-Even Point: The sales volume needed to cover costs.
- Profit Margin: (Revenue - Costs) / Revenue.
For example, if a product sells for $30, and total costs are $20, the profit margin is 33%. Xray shows this instantly for each product in search results.
Using Profitability Data in Decision-Making
When comparing products, sort by estimated profit rather than revenue. A product with high revenue might have low profit due to high costs. For instance, heavy products often have high FBA fees, reducing profitability.
Scenario Analysis
Xray allows you to adjust costs to see how changes affect profit. For example:
- What if I reduce product cost by sourcing differently?
- What if I increase the price?
This helps in planning pricing strategies and cost negotiations.
Limitations and Tips
- Fees are estimates; actual fees may vary slightly.
- Always update costs based on your suppliers.
- Use Xray's profit estimates alongside other factors like competition and demand.
By leveraging the fee calculator, you can focus on products that offer the best profit potential, not just the highest sales.
Avoiding Common Pitfalls When Using Xray ❌⚠️
While Helium 10 Xray is powerful, misinterpreting data or overlooking nuances can lead to poor decisions. Here are common pitfalls and how to avoid them.
Overreliance on Estimates
Xray's data is estimated, not exact. Avoid basing decisions solely on one metric. Cross-check with other tools like Amazon's Best Sellers List or Google Trends.
Ignoring Seasonality
Sales data might be seasonal. For example, Christmas decor sells well in Q4 but poorly in Q1. Use Xray over time to identify patterns.
Neglecting Product Quality
Xray doesn't show product quality or customer satisfaction. Always examine reviews and ratings manually.
Focusing Only on High-Sales Products
High sales often mean high competition. Sometimes, lower-sales niches offer better opportunities due to less competition.
Not Customizing Fee Calculations
If you don't input your actual costs, profit estimates will be inaccurate. Always customize the fee calculator.
How to Mitigate These Pitfalls
- Use Xray as one tool in your research process.
- Validate findings with manual checks.
- Combine with other Helium 10 tools for a comprehensive view.
By avoiding these pitfalls, you'll make more informed and successful product choices.
Advanced Tips for Power Users 🧙♂️🎯
For experienced users, Xray offers advanced features that can enhance research:
Tracking Trends Over Time
Use Xray regularly to monitor how sales and reviews change, identifying emerging trends.
Integrating with APIs
For developers, Helium 10 offers APIs to pull Xray data into custom dashboards.
Using with PPC Data
Combine Xray with Helium 10 Adtomic to see which products are winning in ads.
Analyzing International Markets
Switch Xray to other Amazon marketplaces (e.g., Amazon UK) to research global opportunities.
These advanced techniques can give you an edge in competitive markets.
Conclusion and Next Steps 🏁🔜
Helium 10 Xray is an indispensable tool for Amazon sellers, providing real-time data to inform product research, competition analysis, and profitability estimation. By understanding how to interpret its metrics, avoid common pitfalls, and use advanced features, you can significantly reduce risk and increase your chances of success.
Next Steps:
- Install Xray and configure it for your business.
- Start Researching a niche you're interested in.
- Validate Findings with other tools and manual checks.
- Take Action on insights to launch or optimize products.
With practice, you'll become proficient in using Xray to drive your Amazon business forward. Happy selling! 🎉🛍️
Table: Key Xray Metrics and Their Interpretations
| Metric | What It Means | How to Use It |
|---|---|---|
| Estimated Monthly Sales | Approximate units sold per month | Gauge demand; higher is better but consider competition. |
| Estimated Monthly Revenue | Approximate revenue (price × sales) | Assess market size; compare with costs for profit. |
| Review Count | Total reviews on the product | Indicates product age and popularity. |
| Review Velocity | Rate of new reviews added | Measures recent sales performance. |
| Competition Level | Number of sellers or competition score | Avoid oversaturated niches; aim for balanced competition. |
| Amazon Fees | Estimated fees per unit | Calculate profitability; input your costs for accuracy. |
😊🚀📈🛒🤝💎🔧📉👀🎉
Comments